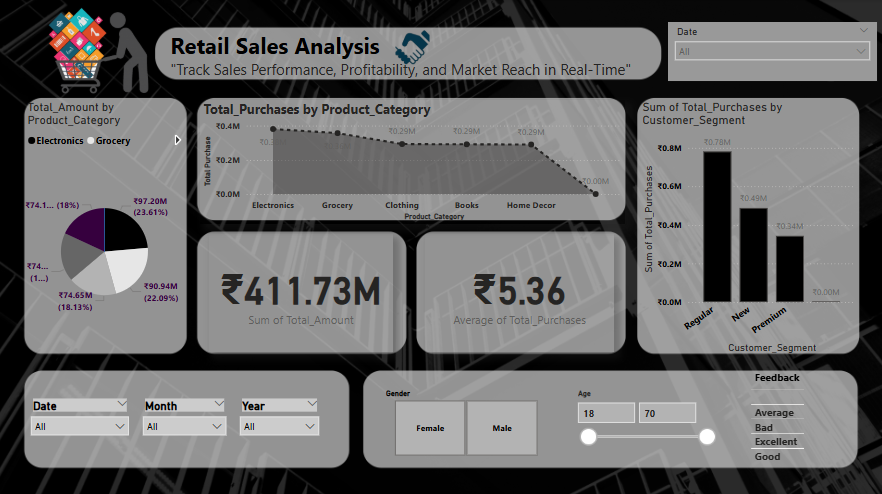
Static preview of the Power BI Dashboard.
Note: A live dashboard could not be embedded. This is a static preview of the report.
Dashboard Highlights
- Retail Sales Overview: Presents total sales (₹411.73M) and average transaction value (₹5.36).
- Product Category Performance: Visual comparison of purchases across Electronics, Grocery, Clothing, etc.
- Customer Segment Analysis: Identifies high-value customer segments (Regular & New).
- Time Filters: Slicers for Date, Month, and Year allow for temporal exploration of sales trends.
- Demographics Insight: Gender and Age-based filtering enhances targeted analysis.
- Feedback Overview: Visual feedback ratings help track customer satisfaction levels.
This dashboard offers a comprehensive snapshot of sales performance, allowing stakeholders to quickly understand key trends and customer behaviors.